Dashboards
Create customised dashboards in LibreNMS per user. You can share dashboards with other users. You can also make a custom dashboard and default it for all users in LibreNMS.
Example Dashboard 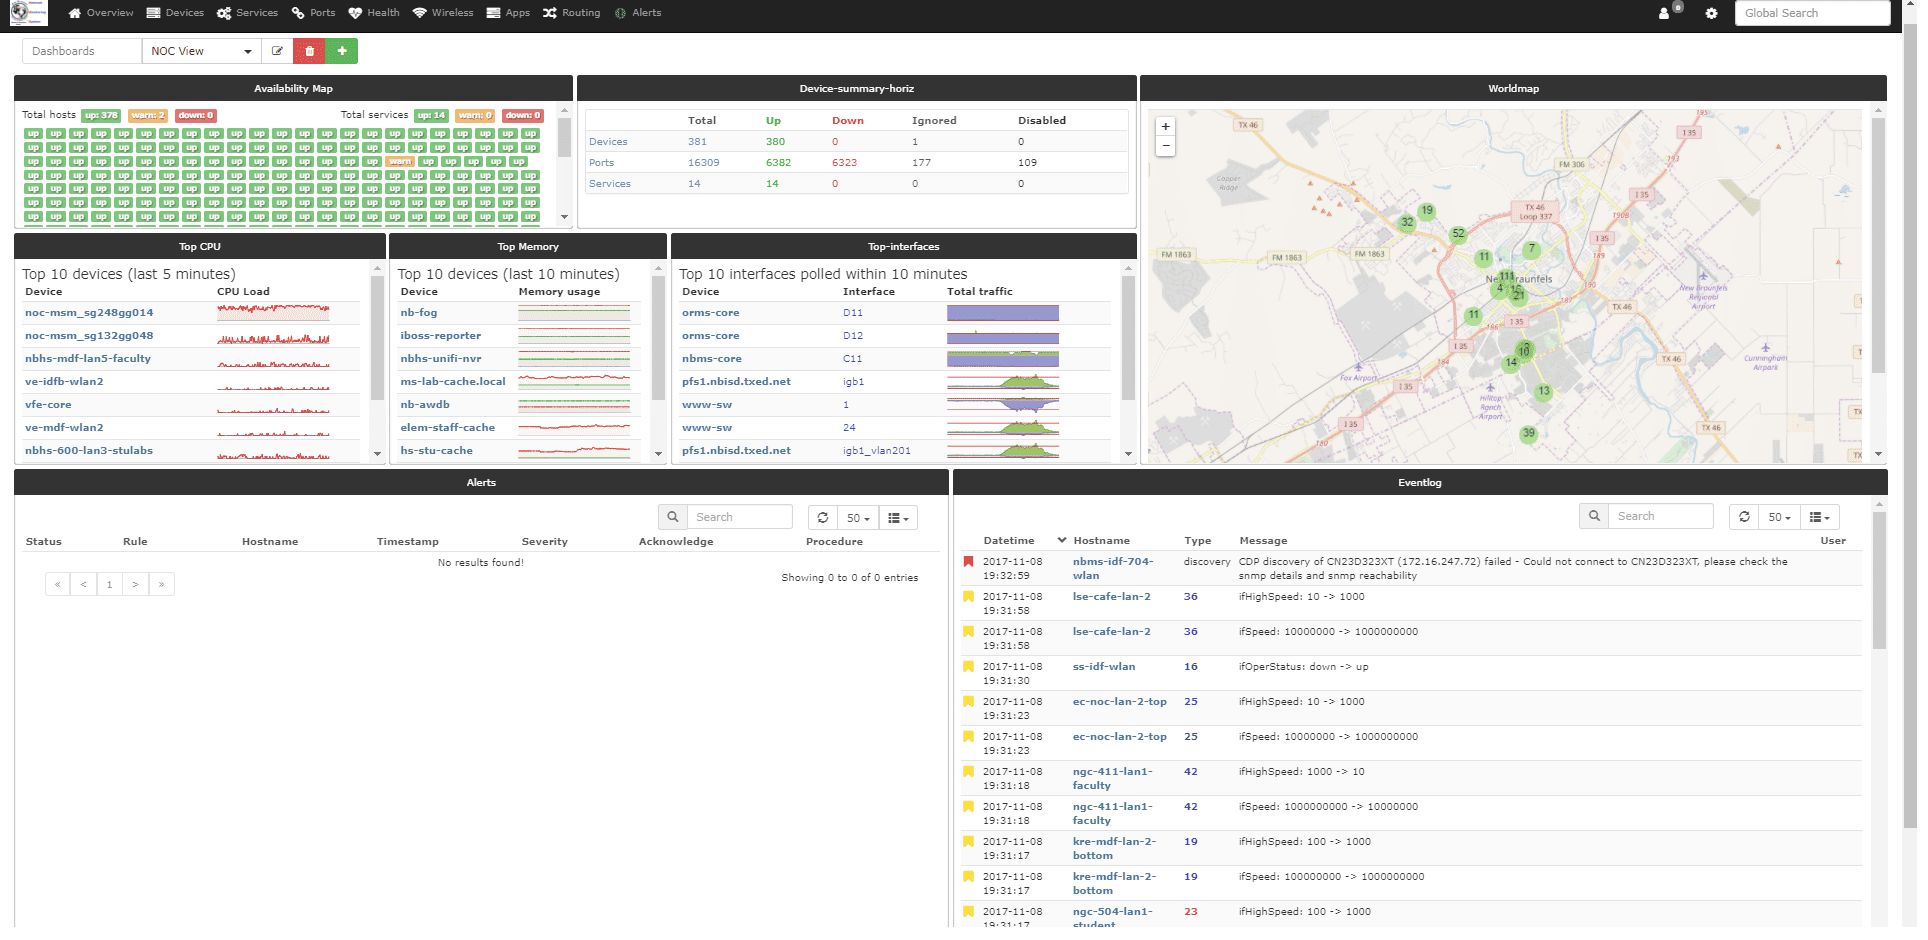
Widgets
LibreNMS has a whole list of Widgets to select from.
- Alerts Widget: Displays all alert notifications.
- Availability Map: Displays all devices with colored tiles, green up, yellow for warning (device has been restarted in last 24 hours), red for down. You can also list all services and ignored/disabled devices in this widget.
- Components Status: List all components Ok state, Warning state, Critical state.
- Device Summary horizontal: List device totals, up, down, ignored, disabled. Same for ports and services.
- Device Summary vertical: List device totals, up, down, ignored, disabled. Same for ports and services.
- Eventlog: Displays all events with your devices and LibreNMS.
- External Image: can be used to show external images on your dashboard. Or images from inside LibreNMS.
- Globe Map: Will display map of the globe.
- Graph: Can be used to display graphs from devices.
- Graylog: Displays all Graylog's syslog entries.
- Notes: use for html tags, embed links and external web pages. Or just notes in general.
- Server Stats: Will display gauges for CPU, Memory, Storage usage. Note the device type has to be listed as "Server".
- Syslog: Displays all syslog entries.
- Top Devices: By Traffic, or Uptime, or Response time, or Poller Duration, or Processor load, or Memory Usage, or Storage Usage.
- Top Interfaces: Lists top interfaces by traffic utilization.
- World Map: displays all your devices locations. From syslocation or from override sysLocation.
List of Widgets:

Dashboard Permissions
- Private: Sets the dashboard to only the user that created the dashboard can view and edit.
- Shared Read: Sets the dashboard to allow other users to view the dashboard, but can't make changes to the dashboard.
- Shared Admin RW: Sets the dashboard to allow other users to view the dashboard, but allows Admins to makes changes.
- Shared: Allows all users to view the dashboard and make changes.
Setting a global default dashboard
Step 1: Set the dashboard to either shared read or shared, depending on what you want the users access to change.
Step 2: Then go to Settings -> WebUI settings -> Dashboard Settings and set the global default dashboard.
Setting embedded webpage
Using the Notes Widget.
<iframe src="your_url" frameBorder="0" width="100%" height = "100%">
  <p>Your browser does not support iframes.</p>
</iframe>
Note you may need to play with the width and height and also size your widget properly.
src="url" needs to be URL to webpage you are linking to. Also some web pages may not support html embedded or iframe. 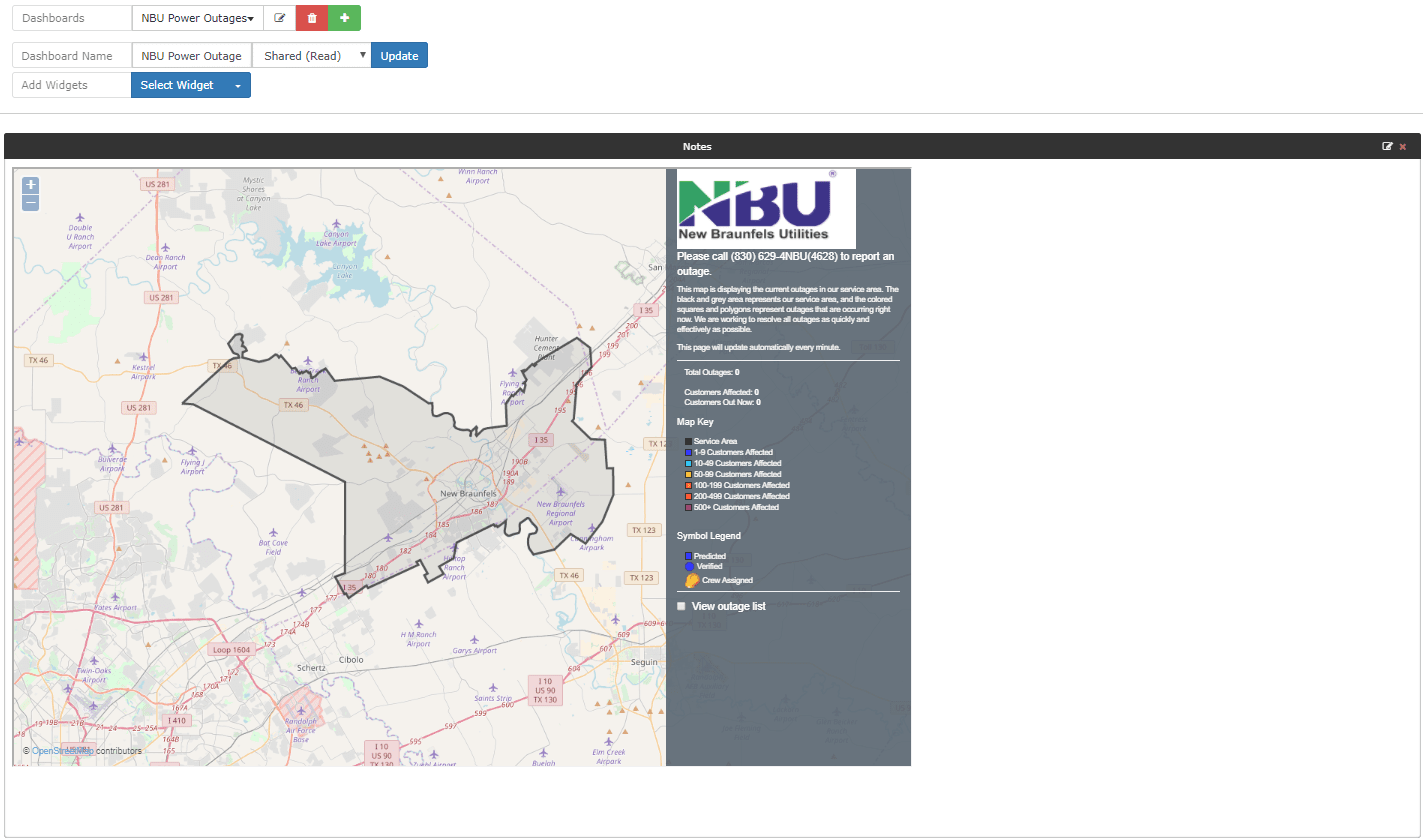
How to create ports graph
In the dashboard, you want to create an interface graph select the widget called
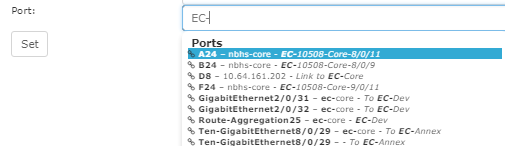
'Graph' then select "Port" -> "Bits" 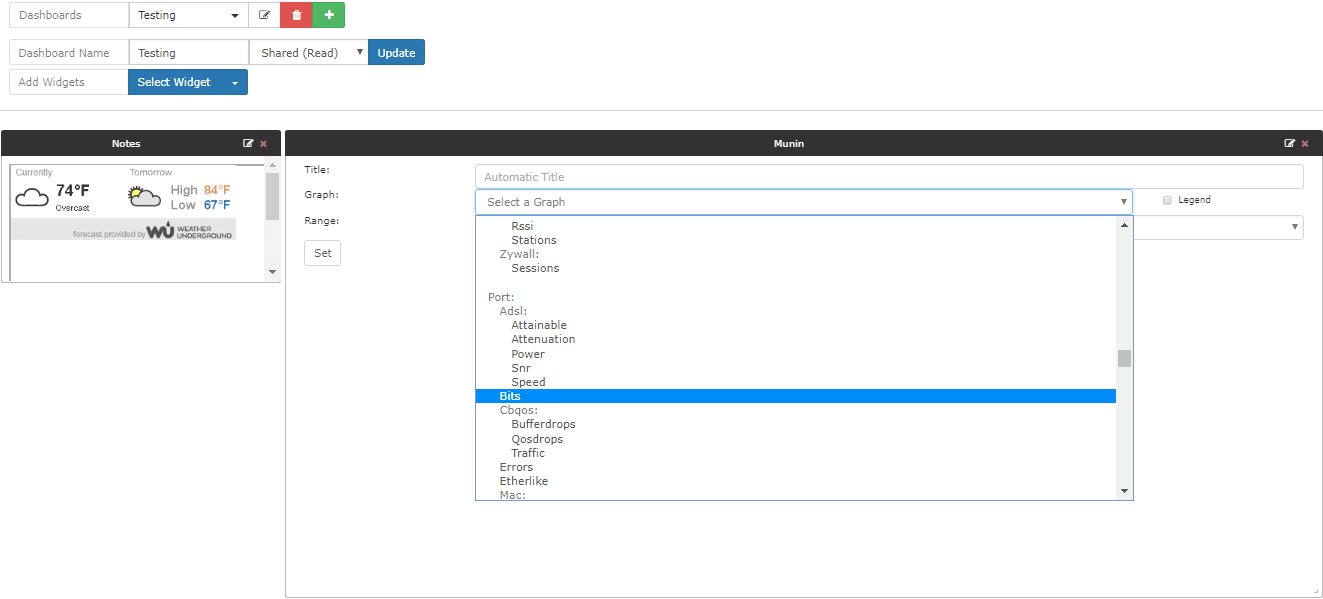
Note: you can map the port by description or the alias or by port id. You will need to know this in order to map the port to the graph.
Dimension parameter replacement for Generic-image widget
When using the Generic-image widget you can provide the width and height of the widget with your request. This will ensure that the image will fit nicely with the dimensions if the Generic-image widget. You can add @AUTO_HEIGHT@ and @AUTO_WIDTH@ to the Image URL as parameters.
Examples: